Data Analytics vs Business Intelligence: Key Differences Explained

Key Highlights:
- Business Intelligence (BI) focuses on monitoring and reporting historical, structured data through dashboards and KPIs for operational decision-making.
- Data Analytics explores structured and unstructured data using statistical and machine learning methods to uncover patterns and predictive insights.
- Together, BI and Data Analytics enable businesses to track performance, forecast trends, and make data-driven strategic decisions.
Business Intelligence vs Data Analytics: Key Differences Explained for Smarter Decision-Making
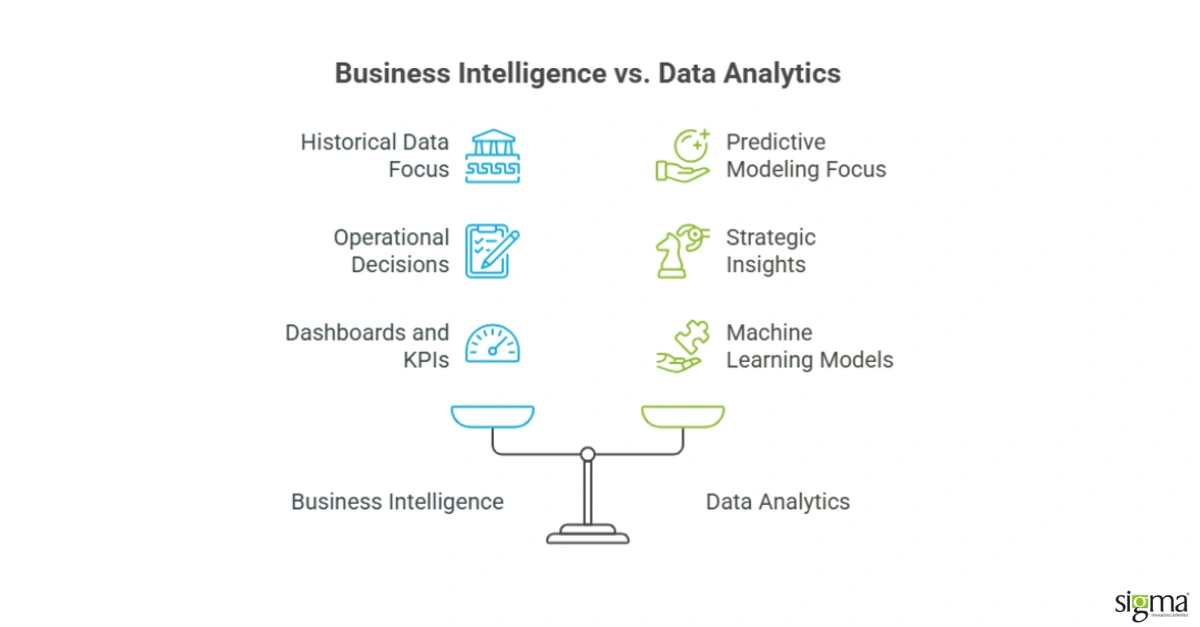
Business Intelligence (BI) and Data Analytics serve complementary but distinct roles in data-driven decision-making. BI focuses on monitoring and reporting historical business performance through dashboards and regular reports, helping leaders make informed, operational decisions. In contrast, Data Analytics digs deeper into data to uncover patterns, trends, and predictive insights, often using advanced statistical methods to answer specific business questions.
- Aspect
- Purpose
- Data Scope
- Outcome
- Tools
- Business Intelligence
- Monitor and report business status
- Structured, historical data
- Dashboards, KPIs, operational decisions
- Power BI, Tableau, Qlik
- Data Analytics
- Explore data to find insights and predict outcomes
- Structured and unstructured data
- Predictive models, trend analysis, optimization
- Python, R, SAS, advanced analytics platforms
For example, a retailer might use Data Analytics to identify buying trends and then leverage BI tools to create visual reports that guide store managers’ decisions. Understanding these differences helps businesses choose the right approach for smarter, data-driven strategies.
What is Business Intelligence?
Business Intelligence (BI) is the technology-driven process of collecting, analyzing, and presenting business data to enable smarter decisions. It transforms raw data into clear, actionable insights through reports, dashboards, and visualizations that help managers monitor performance and spot opportunities.
BI focuses on historical, structured data to provide a comprehensive view of business operations. This empowers organizations to identify trends, improve efficiency, and reduce costs. For example, a sales team might use BI dashboards to track monthly revenue and adjust strategies quickly.
Key features of Business Intelligence include:
- Data aggregation from multiple sources
- Interactive dashboards and visual reports
- Real-time monitoring of key performance indicators (KPIs)
By adopting BI tools like Power BI or Qlik Sense, companies can foster a data-driven culture that supports continuous improvement and competitive advantage.
What is Data Analytics?
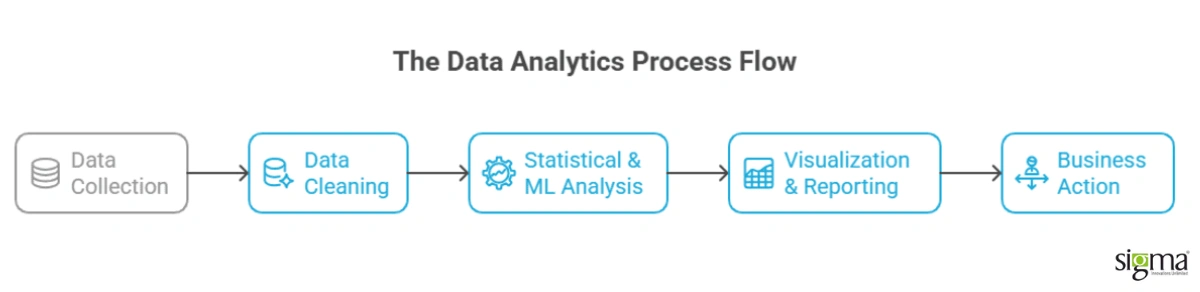
Data Analytics is the process of examining raw data to extract meaningful insights that drive smarter business decisions. Unlike Business Intelligence, which focuses on reporting past performance, data analytics explores patterns, trends, and relationships within both structured and unstructured data. This deeper analysis helps organizations predict outcomes, optimize operations, and identify new opportunities.
Key aspects of data analytics include:
- Collecting and cleaning diverse data sets
- Applying statistical and machine learning techniques
- Interpreting results to guide strategy
For example, an e-commerce company might analyze customer behavior data to forecast demand and tailor marketing campaigns effectively. By leveraging tools like Python or R, businesses can move beyond descriptive reports to predictive and prescriptive insights that enhance competitiveness.
Key Differences Between Business Intelligence and Data Analytics
Business Intelligence and Data Analytics serve distinct but complementary roles in turning data into decisions. While BI focuses on monitoring and reporting historical business performance through dashboards and KPIs, Data Analytics dives deeper to uncover patterns, predict trends, and answer specific business questions using advanced techniques.
| Aspect | Business Intelligence | Data Analytics |
|---|---|---|
| Data Focus | Structured, historical data | Both structured and unstructured data |
| Goal | Reporting and operational decision-making | Exploration, prediction, and optimization |
| Techniques | Aggregation, visualization, reporting | Statistical analysis, machine learning |
| User Base | Business users, managers, executives | Data scientists, analysts |
For example, a retailer may use Data Analytics to identify buying trends and then apply BI tools to visualize these insights for store managers, enabling faster, informed decisions.
Purpose and Focus
Business Intelligence (BI) and Data Analytics serve different but complementary purposes in leveraging data effectively. BI primarily focuses on descriptive analytics—summarizing historical data to provide a clear picture of past and current business performance. This helps organizations monitor operations, track KPIs, and make informed day-to-day decisions.
In contrast, Data Analytics extends beyond description to include diagnostic, predictive, and prescriptive analytics. It aims to uncover why events happened, forecast future trends, and recommend optimal actions. This deeper insight supports strategic planning and innovation.
| Purpose | Focus Area | Outcome |
|---|---|---|
| Business Intelligence | Descriptive analytics | Reporting, dashboards, operational decisions |
| Data Analytics | Diagnostic, predictive, prescriptive analytics | Insights, forecasts, actionable recommendations |
For example, a company may use BI dashboards to track sales performance while applying predictive analytics to forecast demand and optimize inventory.
Data Types and Scope
Understanding the data types and scope is crucial to choosing between Business Intelligence and Data Analytics. Business Intelligence primarily deals with structured, historical data from databases, spreadsheets, and transactional systems. Its scope centers on aggregating and visualizing this data to monitor performance and support operational decisions.
In contrast, Data Analytics handles both structured and unstructured data, including text, images, and social media feeds. It explores large, complex data sets to discover hidden patterns, predict trends, and generate deeper insights. This broader scope enables advanced techniques like machine learning and statistical modeling.
| Aspect | Business Intelligence | Data Analytics |
|---|---|---|
| Data Types | Structured (e.g., sales, finance) | Structured and unstructured (e.g., logs, images) |
| Scope | Monitoring, reporting, dashboards | Exploration, prediction, optimization |
For example, a retailer might use BI to track monthly sales figures but rely on Data Analytics to analyze customer sentiment from reviews and social media. This combination ensures both reliable reporting and innovative insights.
Tools and Technologies
Choosing the right tools is essential for effective Business Intelligence and Data Analytics implementation. BI tools like Microsoft Power BI, Tableau, and Qlik Sense excel at creating interactive dashboards and visual reports that help business users monitor performance without coding. These platforms often support data integration from multiple sources and offer user-friendly drag-and-drop interfaces.
Data Analytics relies more on programming languages and advanced platforms such as Python, R, SAS, and Apache Spark. These tools enable in-depth statistical analysis, machine learning, and predictive modeling, often requiring specialized skills. For instance, Python’s extensive libraries allow analysts to build custom models tailored to unique business questions.
| Tool Type | Examples | Primary Use |
|---|---|---|
| Business Intelligence | Power BI, Tableau, Qlik Sense | Data visualization, dashboards |
| Data Analytics | Python, R, SAS, Apache Spark | Statistical analysis, modeling |
Selecting tools depends on your team’s technical expertise and business goals. Combining both approaches often yields the best insights.
Practical Use Cases of Business Intelligence and Data Analytics
Business Intelligence and Data Analytics drive real-world business improvements through targeted applications. For instance, retailers like Walmart use BI to optimize inventory management by tracking stock levels and sales patterns in real time, enabling smarter restocking decisions. Meanwhile, data analytics helps e-commerce companies analyze customer behavior to personalize marketing campaigns and forecast demand more accurately.
In healthcare, BI dashboards monitor patient outcomes and hospital efficiency, while analytics predict disease trends for proactive care. Telecom firms leverage BI to track service usage, and data analytics to identify churn risks. These practical uses highlight how BI supports operational decisions and reporting, whereas data analytics uncovers deeper insights and future trends.
Common use cases include:
- Inventory and supply chain optimization
- Customer segmentation and personalized marketing
- Performance monitoring and operational efficiency
- Predictive maintenance and risk management
Read our success story: How Sigma’s BI & Analytics Development Services Enabled Agile Data-Driven Decision Making for a Real Estate Leader
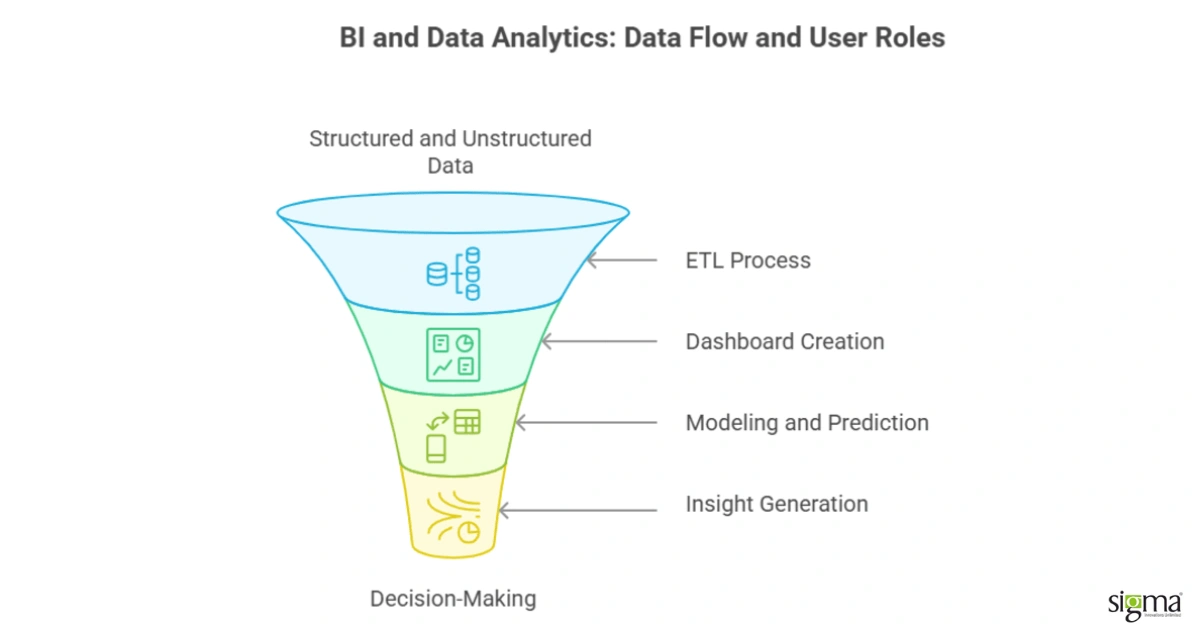
How Business Intelligence and Data Analytics Complement Each Other
Business Intelligence (BI) and Data Analytics work hand-in-hand to turn data into actionable business value. While BI provides accessible dashboards and reports that summarize historical performance, Data Analytics uncovers deeper insights by analyzing patterns and predicting future trends.
This synergy allows businesses to:
- Use analytics-driven insights to inform BI dashboards
- Empower non-technical users with easy-to-understand visualizations
- Automate data processes, saving time and resources
- Make faster, more informed decisions across all levels
For example, a retailer might use data analytics to identify emerging customer preferences and then leverage BI tools to present these findings in interactive reports for store managers. This integration ensures insights are not just discovered but also effectively communicated and acted upon.
Choosing the Right Approach for Your Business
At Sigma Infosolutions, we help businesses strike the right balance between Business Intelligence (BI) and Data Analytics based on their goals, data maturity, and growth stage. Our BI solutions built on platforms like Power BI, Tableau, and Looker deliver intuitive dashboards that make performance monitoring and operational decision-making seamless for business leaders. For organizations aiming to uncover trends, predict outcomes, or solve complex challenges, SigmaInfo’s advanced analytics services leverage machine learning models and statistical techniques to turn raw data into actionable foresight.
When choosing your data strategy, consider:
- Business needs: Do you need real-time reporting or predictive insights?
- Data complexity: Are you working with structured data or multiple data sources?
- Team expertise: Do your teams rely on BI dashboards or need data science support?
- Budget and scalability: What are your tool costs and future data goals?
A growing enterprise like yours could begin with SigmaInfo’s BI dashboards to build visibility across departments, then gradually expand into predictive analytics as the data ecosystem and decision-making needs evolve.
Is Your Data Working for You or Against You? Let’s Fix That. Leverage Sigma’s Business Intelligence Consulting Services
Future Trends in Business Intelligence and Data Analytics
The future of Business Intelligence (BI) and Data Analytics is driven by AI, real-time insights, and user empowerment. Self-service BI tools are making data accessible to non-technical users, enabling faster, independent analysis without relying on IT teams. Artificial intelligence and machine learning are enhancing predictive accuracy and automating complex data tasks, helping businesses anticipate market changes and optimize strategies.
Real-time analytics is becoming essential, allowing companies to react instantly to evolving conditions. Ethical data governance is also gaining prominence, ensuring data quality, security, and responsible use.
To stay competitive, organizations should invest in AI-powered BI platforms, foster a data-literate culture, and prioritize continuous upskilling.
Key future trends include:
- AI-driven predictive analytics
- Self-service and collaborative BI platforms
- Real-time data processing and decision-making
- Ethical and secure data governance
Conclusion: Making the Most of Business Intelligence and Data Analytics
Maximizing the value of Business Intelligence and Data Analytics means leveraging their unique strengths together for smarter decisions. BI offers clear, real-time visibility into your current and past performance, empowering teams with accessible dashboards and reports. Data Analytics complements this by digging deeper—uncovering patterns, forecasting trends, and recommending actions that drive growth.
To make the most of both:
- Align BI tools to monitor key metrics and support daily operations
- Use analytics to explore complex questions and predict future outcomes
- Foster a data-driven culture where insights guide strategy at all levels
- Invest in training to boost data literacy and tool adoption
For example, combining BI dashboards with predictive analytics can help a retailer optimize inventory while anticipating customer demand. This integrated approach ensures your business stays agile and competitive.
Frequently Asked Questions (FAQs)
1. What is the main difference between Business Intelligence and Data Analytics?
Business Intelligence (BI) focuses on monitoring and reporting past and present data through dashboards and KPIs to support operational decisions. Data Analytics, on the other hand, uses statistical and machine learning models to identify patterns, forecast trends, and optimize future strategies.
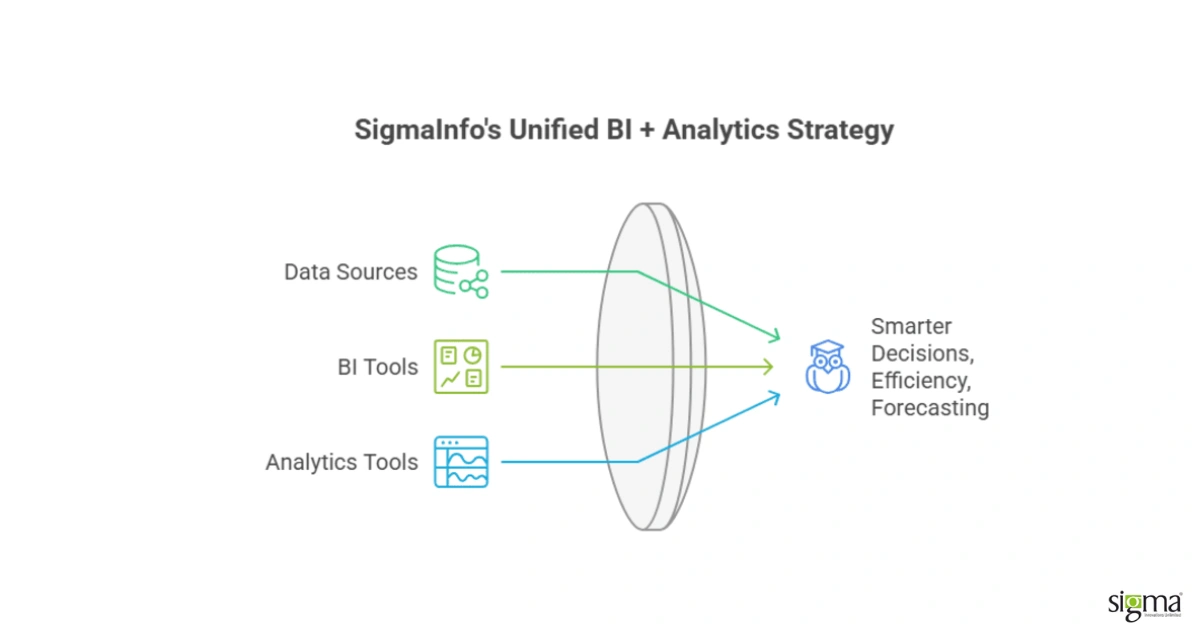
2. How does SigmaInfo help businesses combine BI and Data Analytics?
SigmaInfo integrates modern BI tools with advanced analytics capabilities to deliver a unified data ecosystem. Businesses can monitor performance in real time while also leveraging predictive insights to make smarter, faster decisions across operations, finance, and customer engagement.
3. Why should a business start with Business Intelligence before adopting Analytics?
BI provides the foundation for data visibility and performance tracking. Once organizations establish reliable dashboards and reporting systems, they can expand into advanced analytics for predictive modeling and trend forecasting. SigmaInfo helps companies scale seamlessly from BI maturity to analytics excellence.
4. What tools are used in Business Intelligence and Data Analytics?
Common BI tools include Power BI, Tableau, and Qlik for visualization and reporting. Data Analytics typically relies on tools like Python, R, and SAS for statistical modeling, data mining, and machine learning. SigmaInfo helps businesses integrate both sets of tools into a cohesive analytics stack.
5. How can combining BI and Data Analytics drive business growth?
When used together, BI and Data Analytics offer a full spectrum of insights: from understanding what happened to predicting what will happen next. This integration helps businesses enhance efficiency, reduce costs, identify new opportunities, and improve decision-making across all departments.


