Power BI vs Tableau: How to Choose the Right Platform for Your Organization
Key Highlights:
- The wrong BI platform can lock you into rising costs and rework. Licensing is only the starting point. Implementation, data engineering, governance, administration, adoption, and future changes can make a poor platform decision increasingly expensive.
- A platform that wins the feature comparison can still fail your business. If it does not fit your data architecture, users, governance model, or existing technology investments, adoption and analytics value can suffer.
- The smarter approach is to evaluate Power BI vs Tableau against your actual operating environment, including data sources, reporting requirements, user skills, governance, scalability, and total cost of ownership.
- Sigma Infosolutions evaluates the BI decision from the architecture outward, aligning the platform, data environment, and analytics roadmap to your business requirements rather than forcing a predetermined technology choice.
Introduction
Choosing between Power BI and Tableau can look straightforward until you move beyond the product demonstrations. Both platforms support enterprise reporting, interactive dashboards, data visualization, self-service analytics, and a wide range of data sources. The challenge is not determining whether either platform can support business intelligence. The challenge is determining which one fits your organization’s technology environment, users, governance requirements, operating model, and long-term analytics goals.
That is why a Power BI vs Tableau comparison should not be treated as a simple feature checklist. A platform that looks stronger in a demonstration may not be the right choice once licensing, implementation effort, existing data infrastructure, user adoption, security, administration, and future scaling are considered.
For technology and business leaders, the more useful question is not simply “Which BI platform is better?” It is “Which platform creates the strongest fit with the way our organization already works and where we want our analytics environment to go?”
Why Power BI vs Tableau Is Rarely a Feature Question
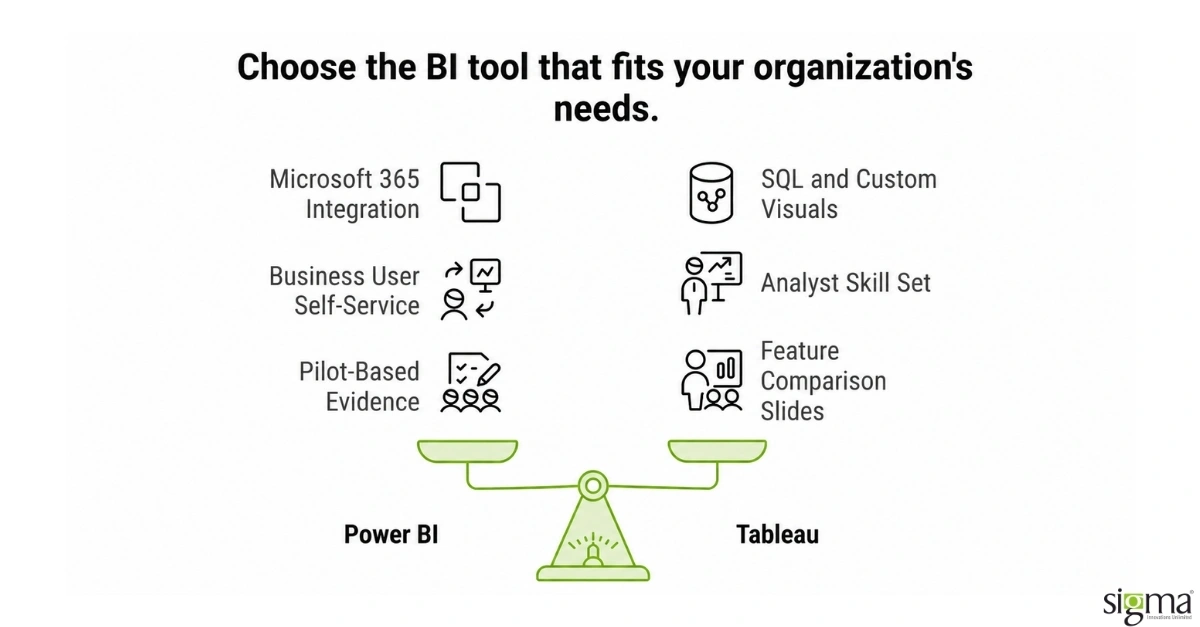
Feature comparisons can establish what each platform is capable of, but they rarely establish which platform is appropriate for a specific organization. Most established BI platforms already cover the core requirements businesses expect, including dashboards, reporting, data visualization, data connections, collaboration, and self-service analytics.
The differences become more meaningful when they are evaluated in the context of the organization. How many people will create reports? How many will consume them? Where does the underlying data reside? Is the business already invested heavily in Microsoft technologies? Does the analytics team require extensive visualization flexibility? How mature are existing data governance practices? Who will administer the environment? What will the platform need to support three or five years from now?
These questions can change the economics and operational fit of the decision considerably.
For example, an organization with significant Microsoft investments may find Power BI easier to incorporate into its existing technology environment and user workflows. An organization with dedicated analytics teams working across diverse data environments may place greater value on Tableau’s analytical and visualization capabilities. Neither scenario makes one platform universally better. It simply demonstrates why the right choice depends on context.
The same principle applies to implementation. Selecting a BI platform without understanding the surrounding data environment can create problems later, particularly when reporting requirements depend on fragmented source systems, inconsistent data definitions, or manual data preparation.
The Real Cost of Choosing the Wrong BI Platform
The financial impact of a BI decision extends well beyond the subscription or license price. A platform can appear cost-effective initially and become more expensive once implementation, administration, data engineering, training, governance, and ongoing development are included.
Licensing should therefore be evaluated alongside the expected number of creators, analysts, consumers, administrators, and other users. Organizations should also consider how those numbers could change as analytics adoption expands. A pricing model that works well for the current user base may produce a different cost profile as more teams begin using analytics.
Implementation is another major consideration. If existing data sources require substantial integration work, reporting logic needs to be rebuilt, or legacy dashboards need to be migrated, the implementation effort can become a significant part of the overall investment.
There is also the cost of adoption. If users find the platform difficult to work with, analytics teams may become a bottleneck while business users continue relying on spreadsheets or manually prepared reports. The resulting cost is not always visible in a software budget, but it can affect how quickly the organization realizes value from its analytics investment.
A meaningful BI platform comparison should therefore consider total cost of ownership rather than license cost alone. The objective is not to identify the cheapest platform. It is to understand which option provides the strongest combination of capability, adoption, operational sustainability, and long-term value.
Rising BI costs?
Power BI vs Tableau: A Side-by-Side Comparison
| Criteria | Power BI | Tableau |
| Cost Model | Per-user licensing with a lower entry tier, often included with Microsoft 365 enterprise agreements | Per-role licensing (Creator, Explorer, Viewer), generally higher entry cost, priced for dedicated BI use |
| Learning Curve | Familiar to Excel users, faster onboarding for business analysts with light training | Steeper initial curve, but rewards analysts who invest in advanced calculations and custom visuals |
| Data Connector Ecosystem | Strong within the Microsoft ecosystem, broad but shallower coverage outside it | Broader native third-party and database connector library, particularly for non-Microsoft data sources |
| Visualization Flexibility | Strong standard visual library, less customization for highly bespoke chart types | Greater flexibility for custom, complex visualizations and drill-down interactivity |
| Deployment Options | Cloud-first as a SaaS product, tightly tied to the Power BI Service | Both cloud (Tableau Cloud) and on-premise (Tableau Server) deployment available |
The table provides a starting point, but it should not become the decision itself. The importance of each factor depends on your organization’s operating model. For one business, Microsoft ecosystem integration may be the dominant consideration. For another, visualization requirements or the skills of its analytics team may carry more weight.
That is why a useful evaluation gives greater weight to the factors that affect your specific environment rather than treating every feature as equally important.
Cost Model and Total Ownership Beyond the License
Power BI and Tableau use different approaches to licensing and packaging, which means comparing published license prices alone can be misleading. The more useful exercise is to model how the platform will actually be consumed across the organization.
Start by identifying the different user groups. A small number of analysts may create and maintain dashboards while hundreds or thousands of employees consume reports. Other organizations may have a much larger population of users creating and exploring analytics themselves. These two operating models can produce very different cost profiles.
Implementation costs should also be included. Existing dashboards, data models, calculated fields, security rules, integrations, and reporting workflows may need to be redesigned or migrated. If the organization’s data environment requires significant preparation before analytics can be trusted, that work should be included in the business case rather than treated as a separate technical issue.
Ongoing administration matters as well. Governance, workspace management, access controls, performance optimization, user support, monitoring, and future dashboard development all contribute to the total cost of ownership.
The right question is therefore not simply “Which platform has the lower license cost?” It is “What will this platform cost to operate effectively across its expected lifecycle?”
Learning Curve, Adoption, and Who Will Actually Use It
A BI platform creates value only when people use it consistently. That makes user experience and organizational adoption important parts of the platform decision.
Power BI may be familiar to organizations where employees already work extensively with Excel and other Microsoft technologies. That familiarity can reduce the friction associated with introducing self-service reporting to broader business teams. Tableau, meanwhile, has a strong position among organizations with dedicated analytics and visualization teams that need flexible exploration of data.
However, organizational skill levels matter more than generalized assumptions about which platform is easier to use. A company with an established Tableau team may face more disruption moving to Power BI than continuing to build on existing expertise. Similarly, a Microsoft-oriented organization may find that introducing Power BI aligns more naturally with existing skills and workflows.
The evaluation should therefore consider who will build dashboards, who will maintain them, who will consume them, and how much self-service analytics the organization actually wants. A platform designed around the wrong operating model can create unnecessary dependence on a small analytics team or result in inconsistent reporting across departments.
See how a documented BI platform evaluation and vendor comparison process typically runs.
Read the blog : 5 Key Questions to Ask When Evaluating BI Tools
Data Connector Ecosystem and Fit With Your Existing Stack
Both Power BI and Tableau provide broad connectivity across databases, cloud environments, files, applications, and other data sources. The number of available connectors, however, is less important than whether the platform works effectively with the systems that matter to your organization.
A financial services company may need reliable connections to core banking systems, loan servicing environments, CRM platforms, financial databases, and cloud data warehouses. An ecommerce organization may need to bring together commerce platforms, marketing systems, ERP data, customer information, and operational reporting.
The evaluation should begin with those actual systems. Determine how data will move into the BI environment, where transformation will occur, how frequently data needs to refresh, and how data quality will be managed. If those questions are not addressed early, a strong BI platform can still produce unreliable or difficult-to-maintain reporting.
This is also where implementation experience becomes important. BI engineering is not simply about connecting a visualization tool to a database. The underlying data model, transformation logic, security requirements, and reporting architecture all influence whether analytics remain reliable as the organization grows.
Visualization Flexibility and Analytics Requirements
Visualization requirements should be evaluated against actual business use cases rather than subjective preferences about which interface looks better.
Organizations building executive dashboards may prioritize clarity, consistency, and standardized reporting. Analytics teams conducting deeper exploration may need greater flexibility to examine relationships between different dimensions of data. Operational teams may require interactive reports that allow them to move from high-level metrics into specific transactions or exceptions.
Power BI provides a broad set of visualization and analytical capabilities, while Tableau is widely recognized for its flexibility in visual analytics. The more important consideration is whether those capabilities match the way your teams work.
A representative evaluation can make this easier to determine. Instead of asking users to choose based on generic dashboards, give both platforms a realistic business scenario using representative data. Ask analysts to perform the same tasks, ask business users to interpret the results, and evaluate how much effort is required to create, maintain, and govern the resulting reports.
That produces more useful evidence than a polished demonstration using unfamiliar data.
Governance, Security, and Scalability Should Be Evaluated Before Selection
Governance is often considered after a BI platform has already been selected. For organizations operating at scale, it should be part of the selection process from the beginning.
The platform needs to support appropriate access controls, identity management, data ownership, workspace or project structures, security policies, audit requirements, and administrative processes. Organizations operating in regulated environments may also need to understand how sensitive information is protected and how access is monitored.
Scalability should be evaluated in a similar way. The question is not simply whether the platform can support more users. It is whether the broader analytics environment can support increasing data volumes, more dashboards, additional business units, higher refresh requirements, and growing self-service adoption without becoming difficult to govern.
These considerations can influence platform selection, architecture, and implementation decisions. Addressing them before deployment reduces the likelihood of rebuilding the environment later.
When Power BI May Be the Better Fit
Power BI may be a strong option for organizations that already have substantial investments in Microsoft technologies and want analytics to fit naturally into that environment. Organizations using Microsoft 365, Azure, Excel, or other Microsoft services may find the broader ecosystem alignment valuable.
It can also be attractive when the objective is to expand analytics access across a broad business-user population. Organizations that want business teams to move from spreadsheet-based reporting toward governed self-service analytics may see value in the platform’s familiarity and ecosystem integration.
That does not mean Power BI is automatically the right choice for a Microsoft-centric organization. The data architecture, reporting requirements, governance model, existing skills, and expected scale still need to be evaluated before making the decision.
When Tableau May Be the Better Fit
Tableau may be appropriate for organizations where analytical exploration and visualization flexibility are particularly important. Dedicated analytics teams and organizations working across diverse data environments may value the platform’s capabilities for exploring complex datasets and communicating analytical findings visually.
It can also make sense when an organization already has significant Tableau expertise and established reporting processes built around the platform. Replacing a mature environment simply because another platform offers an attractive feature set may introduce migration costs without creating a corresponding business benefit.
As with Power BI, the decision should be based on the complete environment rather than one perceived platform advantage.
Don’t Choose Power BI or Tableau From a Vendor Demo Alone
Vendor demonstrations are useful for understanding what a platform can do, but they rarely show what it will take to operate that platform inside your organization.
A stronger evaluation uses representative business scenarios. Select several reports that reflect real executive, operational, and analytical requirements. Use representative data sources and evaluate the complete workflow from data preparation through dashboard consumption.
The assessment should consider more than visual output. Look at implementation effort, data preparation, performance, security, administration, user experience, development skills, and ongoing maintenance. If possible, involve the people who will actually build and consume the analytics rather than limiting the evaluation to procurement or IT.
This approach provides a clearer view of the operational implications of the decision and gives leadership stronger evidence for the business case.
The BI Platform Is Only One Layer of the Analytics Architecture
One of the most common mistakes in BI initiatives is treating the visualization platform as the entire analytics strategy.
A typical analytics environment includes source applications, data integration, a warehouse or lakehouse, data transformation and modeling, governance, the BI platform, and the business users who consume the resulting insights. Problems in any of those layers can affect the quality of reporting.
If sales, finance, operations, and customer data remain fragmented across systems, moving from one visualization platform to another may not resolve the underlying reporting problem. If data definitions are inconsistent, dashboards may produce different answers regardless of which BI tool is selected.
This is why platform selection should happen alongside an assessment of the broader analytics architecture. The objective should be to create a reliable path from operational data to trusted business insight, with the BI platform serving as one important layer within that architecture.
Sigma Infosolutions Implements the Platform That Fits Your Data, Not the One That Pays Best
Sigma Infosolutions Implements the Platform That Fits Your Data, Not the One That Pays Best
Choosing between Power BI and Tableau is only one part of the BI decision. The more important question is how the platform will fit into the organization’s existing data architecture, reporting environment, user model, governance requirements, and long-term analytics roadmap. That is where Sigma Infosolutions takes a platform-agnostic approach to BI and analytics engineering.
Sigma evaluates the environment before recommending the technology. For a Microsoft-centric organization with broad business-user adoption requirements, Power BI may be the right fit. For an organization with established Tableau expertise or more specialized visualization requirements, Tableau may make more sense. In some cases, neither platform is the immediate priority because fragmented data, weak data models, or governance gaps need to be addressed first.
This approach keeps the technology decision connected to the business problem. Data integration, modeling, security, governance, performance, and user adoption all influence whether a BI environment becomes a reliable decision-making capability or simply adds another reporting layer for teams to maintain.
Sigma’s experience reflects this broader engineering perspective. For a Goldman Sachs-backed digital diligence platform serving more than 50,000 users, Sigma delivered embedded Power BI capabilities that consolidated reporting requirements across five systems. The solution incorporated capabilities including natural language querying and row-level security, creating a more unified analytics experience within the platform. What began as a three-month engagement ultimately extended to three years as the platform and analytics requirements evolved.
The lesson for organizations evaluating Power BI vs Tableau is straightforward: selecting the visualization platform is not the end of the architecture decision. The right implementation connects the BI layer to the data environment, security model, reporting requirements, and product roadmap. Sigma approaches that decision from the architecture outward, so the technology supports how the business actually needs to use analytics.
Conclusion
Power BI vs Tableau is ultimately a fit decision rather than a feature contest. Both platforms can support sophisticated business intelligence environments, but the right choice depends on how well the platform aligns with the organization’s existing technology landscape, data architecture, users, governance model, reporting requirements, and long-term analytics strategy.
For Microsoft-centric organizations seeking broad business-user adoption, Power BI may provide a natural fit. For organizations prioritizing analytical flexibility, visualization, or established Tableau expertise, Tableau may be the stronger option. Neither conclusion should be made without evaluating the complete operating environment.
The most reliable approach is to assess the architecture first, identify the business and reporting requirements, model the total cost of ownership, and validate the shortlisted platform using representative data and workflows. That turns a software comparison into a technology decision backed by evidence.
For organizations that need more than a BI tool selection and are looking to build a scalable analytics environment around their existing data and business requirements, the right engineering partner can make that decision significantly more informed.
Comparing Power BI vs Tableau for your existing data environment?
Evaluate architecture, cost, governance, and adoption risks before committing to a BI platform with Sigma’s BI & Analytics Development Services.
Frequently Asked Questions
Is Power BI or Tableau better for a company already standardized on Microsoft 365 and Azure?
Power BI generally fits better in that environment, since its licensing often bundles with existing Microsoft 365 tiers and its connectors to Azure, Dynamics 365, and Excel are deeper than Tableau’s. That said, connector depth should be weighed against visualization needs before the decision is finalized.
Which platform has a lower total cost of ownership, Power BI or Tableau?
Neither is universally cheaper once real usage is accounted for. Power BI’s per-user pricing suits organizations spreading report building across many business users, while Tableau’s per-role licensing suits a small analytics team serving a much larger group of read-only viewers. Total cost depends heavily on usage pattern, not the sticker price of either license alone.
How much longer does it take a team to become productive in Tableau compared to Power BI?
Power BI’s Excel-like interface typically produces a shorter initial ramp, especially for business analysts already comfortable in Microsoft’s tools. Tableau’s learning curve is steeper upfront but rewards analysts who invest further, gaining more control over calculated fields, custom visuals, and drill-down interactivity than Power BI’s more guided authoring experience typically allows.
Can Power BI and Tableau connect to the same data sources?
Largely yes for common databases and cloud data warehouses, but native coverage differs meaningfully. Power BI has deeper native connectors within the Microsoft ecosystem, Azure, Dynamics, and Excel, while Tableau maintains broader native coverage across third-party and non-Microsoft sources, which matters most for an organization running a heterogeneous, multi-vendor data stack.
Does switching platforms later cost more than choosing the first time correctly?
Yes, typically, and meaningfully so. Rebuilding dashboards, retraining users, and re-licensing after a platform switch costs far more than the incremental time spent evaluating fit upfront, which is why a criteria-based comparison against the organization’s actual data stack and team skill set is worth the extra weeks before committing budget.