Customer Analytics and Cohort Analysis for Churn Reduction: A Complete BI Guide (2026)

Key Highlights:
- SaaS companies and product teams lose significant revenue every quarter because they lack the customer analytics infrastructure needed to detect churn signals before they become cancellations.
- Modern business intelligence platforms powered by cohort analysis, unified dashboards, and retention-focused reporting give organizations the visibility they need to intervene at the right moment in the customer lifecycle.
- Sigma Infosolutions designs and builds end-to-end BI ecosystems that integrate cohort analysis, customer intelligence reporting, and data visualization into a single, actionable analytics layer for marketing leaders and product teams.
Introduction
Customer analytics has become the single most critical capability for SaaS companies competing in a market where acquisition costs continue to rise and retention defines long-term profitability. When organizations lack visibility into customer behavior patterns, churn grows silently until it becomes a structural problem that no campaign or discount can reverse.
The consequences of poor analytics infrastructure are measurable. Marketing leaders spend budgets targeting new users while existing high-value customers quietly disengage. Product teams ship features without knowing which user segments actually drive retention. Analytics managers report on what happened last quarter rather than predicting what will happen next week.
The solution lies in building a modern business intelligence layer that puts customer analytics at the center of every growth decision. When cohort analysis, lifecycle data, and behavioral signals are unified in a single platform, retention becomes a manageable, measurable, and improvable metric rather than a guessing game.
Organizations that invest in purpose-built customer analytics infrastructure consistently outperform those that rely on disconnected reporting tools. They identify at-risk segments earlier, personalize interventions more effectively, and make product decisions backed by real customer lifecycle data. This guide walks through the full architecture of a retention-focused BI system and explains how to implement it in 2026.
Why Customer Analytics Is the Foundation of Retention Strategy
The Gap Between Data and Insight
Most organizations today collect enormous volumes of customer data but struggle to convert it into actionable retention intelligence. CRM systems hold contact records. Product platforms log events. Marketing tools track campaign touchpoints. The problem is that these systems rarely speak to each other, and the result is a fragmented view of the customer that no single team can act on.
Without unified customer analytics, churn analysis becomes reactive. Teams investigate after the cancellation, not before it. By the time a data analyst produces a report showing which cohort churned in Q3, the window for intervention has already closed.
The shift to a proactive retention model requires a business intelligence architecture that brings all these data sources together, applies cohort logic to segment customer behavior over time, and surfaces insights in dashboards that marketing, product, and customer success teams can act on immediately.
What Modern Business Intelligence Adds to Retention
Modern BI platforms go beyond static reporting. They apply machine learning to identify behavioral patterns that precede churn, score customers by risk level, and trigger automated workflows when a customer crosses a predefined engagement threshold.
A SaaS company that deploys a retention-focused BI layer gains several immediate advantages. It can segment customers by acquisition channel and measure which sources produce the highest lifetime value. It can track product adoption milestones and identify which features correlate with long-term retention. And it can build a predictive model that flags disengaged accounts weeks before they cancel.
This is the core value proposition of modern customer analytics: it turns historical data into forward-looking intelligence that revenue teams can use today.
Cohort Analysis: The Cornerstone of Retention Intelligence
Understanding Cohort Logic
Cohort analysis groups customers by a shared characteristic, typically their acquisition date, and tracks their behavior over time as a group. Instead of looking at aggregate metrics that blend new and existing customers together, cohort analysis isolates the performance of specific customer groups across their full lifecycle.
This approach reveals patterns that aggregate reporting hides. A cohort acquired through a paid search campaign in January may retain 80% after six months. A cohort acquired through a free trial offer in March may retain only 45% over the same period. Without cohort analysis, both groups blend into a single retention number that tells leadership almost nothing about where to intervene.
Read the Blog: How AI Forecasting Transforms Strategic Planning for Businesses
How to Structure a Cohort Analysis Framework
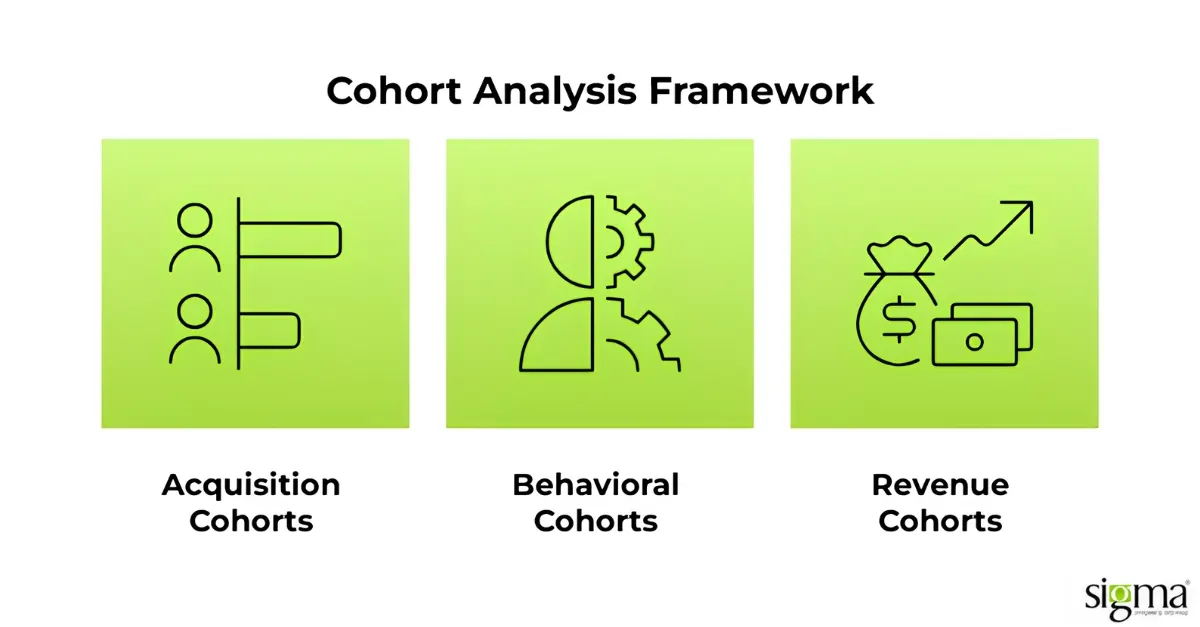
An effective cohort analysis framework for churn reduction includes three layers:
- Acquisition Cohorts: Segment customers by the month or quarter they first paid. Track their retention, expansion, and churn rates over 3, 6, and 12-month intervals.
- Behavioral Cohorts: Group customers by the actions they took during onboarding. Did they complete the setup? Did they invite team members? Did they integrate a third-party tool? These behavioral signals often predict long-term retention far more accurately than any demographic attribute.
- Revenue Cohorts: Segment customers by their initial contract value or plan tier. Understand whether high-value customers churn at different rates than entry-level customers and identify which segments deserve the most investment in success resources.
When these three cohort layers are combined in a unified BI dashboard, product teams and marketing leaders gain a complete picture of the customer lifecycle and can make decisions with confidence.
Building a BI Ecosystem for Customer Lifecycle Visibility
Data Unification and Pipeline Architecture
The foundation of any effective customer analytics system is a reliable data pipeline that consolidates records from every customer touchpoint. This typically involves a cloud data warehouse such as Amazon Redshift, Google BigQuery, or Snowflake, combined with an ETL layer that normalizes data from CRM, product, billing, and support systems into a consistent schema.
Without this foundation, cohort analysis and retention reporting rest on incomplete data. Gaps in the pipeline produce unreliable metrics, and unreliable metrics erode confidence in the BI system among the business stakeholders who need to act on it.
Dashboard Design for Retention Teams
BI dashboards for retention should be designed around the workflows of the teams that use them, not the capabilities of the tools that power them. A marketing leader needs a view of customer acquisition by channel, retention curve by cohort, and net revenue retention by segment. A product manager needs feature adoption rates, onboarding completion funnels, and engagement frequency by plan tier.
Building dashboards that serve these distinct needs requires both technical expertise in data modeling and a clear understanding of how retention decisions get made at the organizational level. Analytics tools are only as useful as the decisions they enable.
Predictive Analytics and AI-Driven Churn Scoring
The most advanced layer of a customer analytics ecosystem is a predictive churn model that assigns a risk score to every active customer based on their recent behavior. These models use machine learning to identify the combination of signals, such as declining login frequency, reduced feature usage, or an unresolved support ticket, that most reliably predict cancellation.
When churn scores are surfaced in a unified dashboard alongside cohort data and lifecycle metrics, customer success teams can prioritize their outreach based on quantified risk rather than intuition. This transforms retention from a reactive function into a proactive revenue protection strategy.
How Sigma Infosolutions Helps Build Retention-Focused Customer Analytics Systems
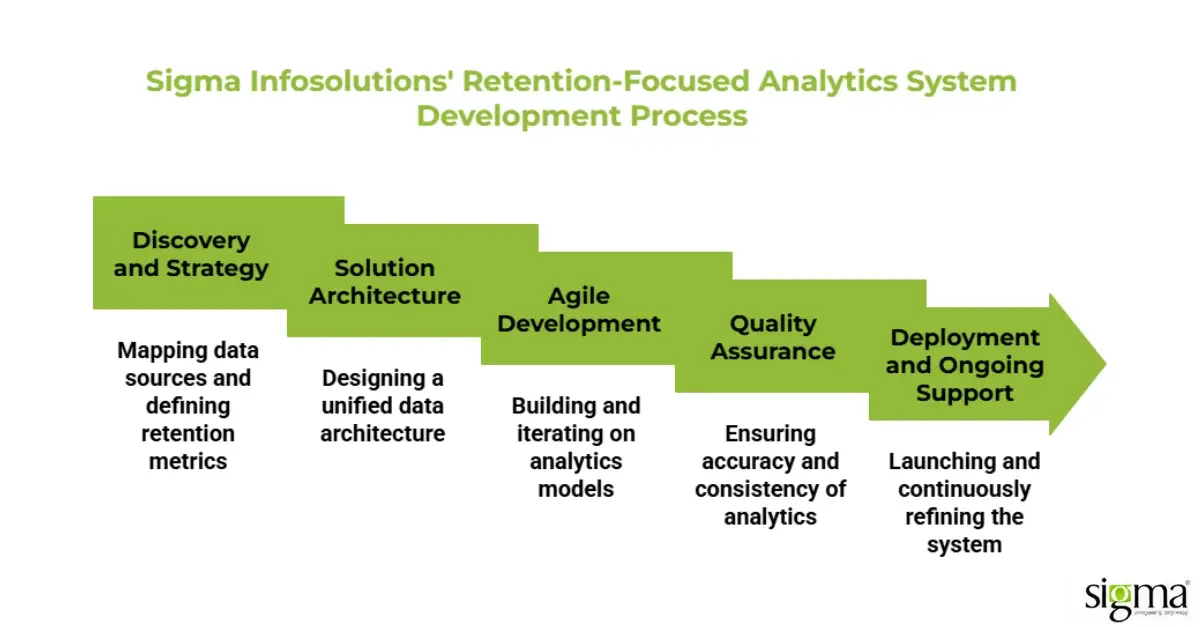
Sigma Infosolutions delivers end-to-end BI and Analytics Development Services designed specifically for organizations that need to reduce churn, improve customer lifecycle visibility, and make retention decisions backed by real data.
Discovery and Strategy
Sigma begins every engagement with a structured discovery phase to map existing data sources, identify gaps in the analytics pipeline, and define the key retention metrics that matter most to the client’s business. This phase ensures that the BI system is designed around business outcomes, not technical defaults.
Solution Architecture
Sigma’s engineering team designs a unified data architecture that connects CRM, product, billing, and support data into a single source of truth. The architecture is built to support cohort analysis, behavioral segmentation, and predictive modeling at scale, using cloud-native tools that are reliable, maintainable, and cost-efficient.
Agile Development
Using an agile delivery model, Sigma builds and iterates on dashboards, data pipelines, and analytics models in short sprints. This approach allows marketing leaders and product teams to see value quickly and provide feedback that shapes the final system before full deployment.
Quality Assurance
Every BI system Sigma delivers goes through rigorous data validation to ensure that cohort calculations, retention metrics, and churn scores are accurate and consistent across all dashboards. Inaccurate analytics are worse than no analytics, and Sigma’s QA process ensures that business stakeholders can trust every number they see.
Deployment and Ongoing Support
After launch, Sigma provides ongoing support to refine models, add new data sources, and evolve dashboards as the client’s business grows. Retention analytics is not a one-time project; it is a continuous capability that improves over time as more customer data becomes available.
Conclusion
Customer analytics is no longer a competitive advantage reserved for enterprises with large data science teams. In 2026, any SaaS company, product team, or marketing organization that wants to reduce churn and grow net revenue retention must invest in a modern BI ecosystem built on cohort analysis, unified dashboards, and predictive intelligence.
The organizations that get this right will identify at-risk customers before they cancel, understand which acquisition channels produce the highest lifetime value, and make product decisions grounded in real customer lifecycle data. Those that continue to rely on disconnected reporting tools will keep fighting the same churn problem quarter after quarter.
Sigma Infosolutions brings the engineering depth and business intelligence expertise to build these systems correctly from day one. Whether you are starting from scratch or modernizing an existing analytics stack, Sigma can deliver a customer analytics platform that supports retention-focused decision-making at every level of your organization.
Frequently Asked Questions
1. What is customer analytics in SaaS?
Customer analytics is the process of analyzing customer behavior, engagement, and revenue data to improve retention and reduce churn.
2. How does cohort analysis help reduce churn?
Cohort analysis groups customers by acquisition date or behavior to reveal retention patterns and identify which segments are most likely to churn.
3. What is the difference between customer analytics and churn analytics?
Customer analytics covers the entire customer lifecycle, while churn analytics focuses specifically on identifying and preventing customer cancellations.
4. Which metrics are most important for churn reduction?
Key metrics include customer retention rate, churn rate, customer lifetime value (CLV), feature adoption, and net revenue retention (NRR).
5. What tools are commonly used for customer analytics?
Popular tools include Snowflake, Google BigQuery, Amazon Redshift, Tableau, and Power BI.
6. What is a predictive churn model?
A predictive churn model uses machine learning to assign risk scores to customers based on behavioral and engagement signals.
7. Why is a unified BI dashboard important for retention?
A unified BI dashboard consolidates customer, product, billing, and support data into one view for faster and more informed retention decisions.
8. How long does it take to build a customer analytics platform?
Depending on data complexity and business requirements, implementation typically takes between 6 and 16 weeks.
9. How does Sigma Infosolutions support churn reduction?
Sigma Infosolutions builds custom BI ecosystems with cohort analysis, predictive analytics, and retention dashboards tailored to business goals.
10. What business benefits come from investing in customer analytics?
Customer analytics helps reduce churn, increase customer lifetime value, improve marketing ROI, and drive sustainable revenue growth.