Why a Tableau Business Intelligence Solution Becomes Shelfware and How to Avoid It

Key Highlights:
- A BI platform cannot fix poor data foundations. Fragmented data, inconsistent metrics, and unclear ownership can turn Tableau into shelfware.
- Tableau fit depends on readiness, not features. Data maturity, team capacity, governance, and reporting complexity should drive the decision.
- The wrong sequence increases BI costs. Buying first can leave organizations paying for capabilities they cannot effectively adopt or scale.
- Sigma assesses fit before recommending technology. The focus is on data, business requirements, governance, and long-term analytics value—not a predetermined platform.
Introduction
Before comparing Tableau with other business intelligence platforms, there is a more fundamental question to answer: is a Tableau business intelligence solution the right fit for your organization today?
Tableau is a mature visualization and analytics platform, but platform capability does not automatically translate into business value. An organization working with inconsistent data across spreadsheets, disconnected source systems, or manually reconciled reports may not be ready to realize the value of an advanced visualization environment. The same applies to teams that lack the capacity to develop, govern, and maintain dashboards over time.
For a Head of Data, VP of Analytics, CIO, or technology leader, the decision is therefore less about whether Tableau is capable and more about whether the organization’s data foundation, team capacity, reporting requirements, and governance model can support the investment.
Getting that distinction right matters because a BI platform is not the data strategy itself. It sits on top of the organization’s data environment and reporting processes. If those foundations are weak, purchasing a more capable visualization platform can simply move the problem further downstream.
The better approach is to assess organizational readiness first and then determine whether Tableau, another BI platform, or a prerequisite data initiative represents the most appropriate investment.
Signals That Point Toward Tableau Fitting Your Organization
Certain organizational conditions indicate that Tableau can be a strong fit.
The first is data maturity. Organizations with data centralized in a cloud data warehouse or a manageable number of structured source systems are generally in a stronger position to use Tableau effectively. When core business data is consistent, accessible, and governed, analytics teams can spend more time producing useful insights rather than manually reconciling inputs.
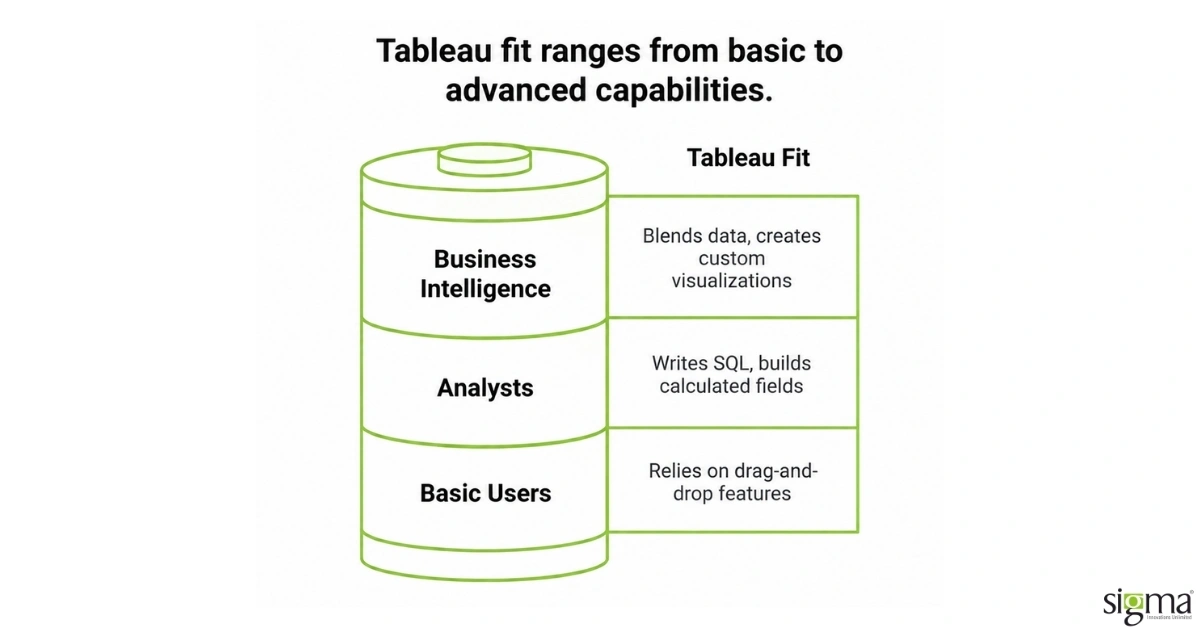
The second is team capability. Tableau’s value extends beyond basic dashboard creation. Organizations that have analysts or analytics partners capable of working with SQL, calculated fields, data relationships, and dashboard design are better positioned to take advantage of its broader capabilities. This does not mean an organization needs a large analytics department. It means there needs to be sufficient ownership to build, maintain, govern, and evolve the reporting environment.
The third is reporting complexity. Tableau becomes more compelling when business users need interactive analysis, detailed drill-downs, multiple data sources, sophisticated visualizations, or dashboards that support different analytical questions. If the reporting environment needs to move beyond static reports and predetermined metrics, the depth of a Tableau business intelligence solution can become commercially relevant.
When centralized data, sufficient analytical ownership, and meaningful reporting complexity exist together, Tableau is more likely to justify its investment.
Signals That Point Toward a Different BI Approach First
Other organizational conditions suggest that the immediate priority may not be the BI platform itself.
If business data remains fragmented across disconnected spreadsheets, operational applications, and manually maintained files, the organization may gain more value from addressing data centralization and consistency first. A visualization platform can expose data problems, but it does not eliminate the need for reliable definitions, consistent source data, and appropriate governance.
Team capacity is another consideration. An organization may have a strong data foundation but insufficient internal resources to develop and maintain its analytics environment. This does not necessarily mean Tableau is the wrong choice. It may mean implementation ownership, enablement, governance, and ongoing analytics support need to be part of the investment from the beginning.
Reporting complexity also matters. A business that needs only a limited set of standardized metrics on a predictable reporting cadence may not need the full depth of a dedicated visualization platform. In that situation, a simpler or more tightly integrated BI capability may provide a better balance between functionality, adoption, cost, and operational overhead.
These conditions do not make Tableau a bad platform. They indicate that the sequence of investment matters. Organizations should distinguish between a platform-fit problem and a readiness problem before committing budget.
A common middle case is an organization with mature data but limited internal analytics capacity. Here, the data foundation may already support Tableau, while the organization lacks the resources to turn that foundation into a sustainable reporting environment. An implementation partner can address that gap by establishing the initial analytics environment, governance model, and reporting framework while building internal capability over time.
Treating data readiness and team readiness as separate variables produces a more useful investment decision than treating the organization as simply “ready” or “not ready.”
Assessing Organizational Readiness Before Comparing Platforms
A practical readiness assessment can start with three areas: data maturity, team capability, and reporting complexity.
The value of this assessment is not in producing a perfect score. It is in identifying where the investment could encounter friction after implementation.
For example, strong data maturity combined with weak team capacity does not necessarily mean the organization should abandon Tableau. It may indicate that implementation and ongoing analytics ownership need to be included in the business case. Conversely, strong analytical talent cannot compensate indefinitely for unreliable or fragmented source data.
The assessment should therefore involve both technology stakeholders and business users. Data teams understand the technical constraints, while business stakeholders understand how reports are actually consumed and where existing reporting processes create operational friction. Comparing these perspectives can expose gaps that a technology-only evaluation may overlook.
This is also why platform comparisons should come later. Comparing Tableau with Power BI, Looker, or another BI platform before understanding organizational readiness can create a false sense of progress while the more important data and operating-model questions remain unanswered.
| Readiness Factor | Signals Tableau Fits Now | Signals a Prerequisite Step First |
| Data Maturity | Data centralized in a warehouse or a small number of clean source systems | Data still fragmented across disconnected spreadsheets with no single source of truth |
| Team Skill Set | At least one analyst comfortable with SQL and calculated fields | No internal capacity to learn Tableau’s calculation language without outside support |
| Reporting Complexity | Genuine need for interactive drill-down or multi-source blending | Reporting need is a small set of standard metrics reviewed on a fixed cadence |
Why Getting the Fit Decision Right Matters More Than the Platform Choice Itself
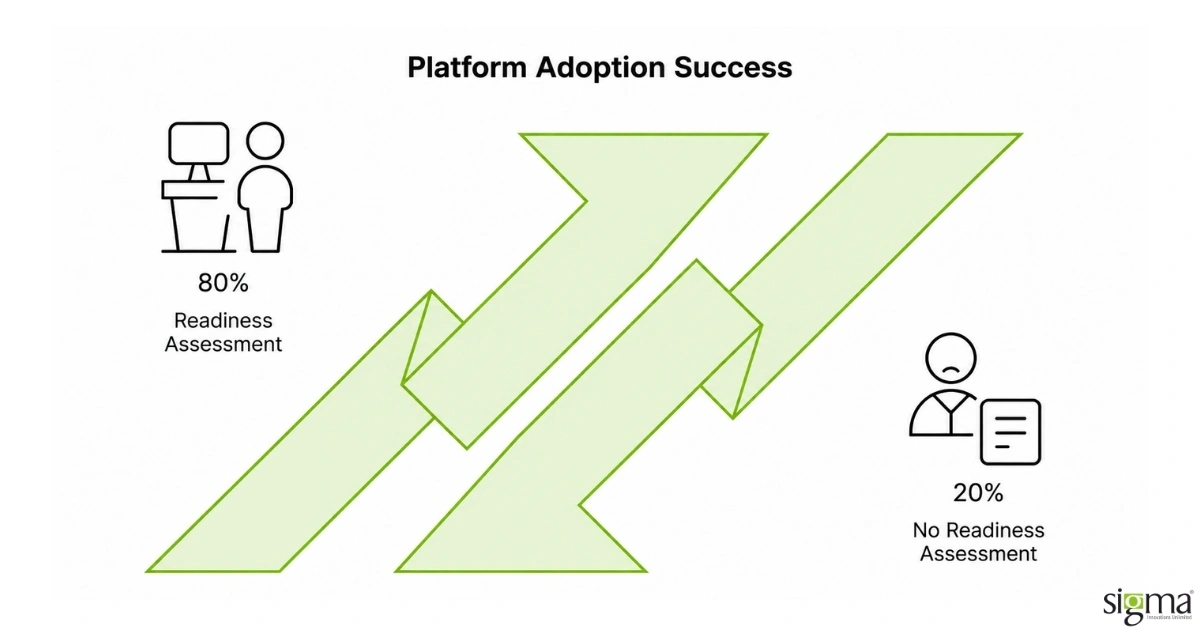
The cost of a BI investment extends beyond the software license.
There is the implementation effort, data integration work, dashboard development, governance, user adoption, training, maintenance, and ongoing evolution of the reporting environment. If the organization is not prepared to address these areas, even a capable platform can remain underused.
This is where BI investments can become shelfware. The organization continues paying for the technology, but business users return to spreadsheets or existing reporting processes because the new environment does not provide trusted information quickly enough or because nobody owns its continued development.
The underlying problem is rarely that the BI platform cannot produce the required report. More often, the organization purchased the visualization capability before resolving the conditions required for sustained adoption.
A more defensible investment sequence is therefore:
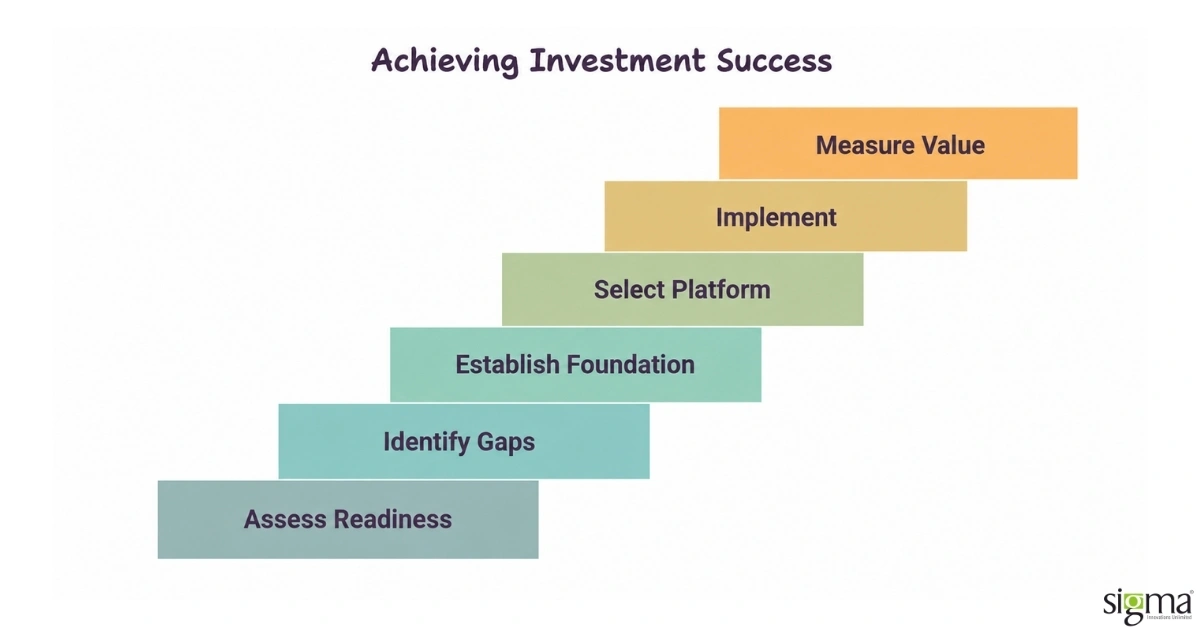
This sequence also changes how platform comparisons should be conducted. Instead of asking which BI product has the longest feature list, decision-makers can evaluate which platform aligns with the organization’s existing architecture, analytical capabilities, reporting requirements, governance expectations, and long-term operating model.
That creates a technology decision grounded in business requirements rather than product familiarity.
Sigma Infosolutions Assesses Fit Before Recommending a Platform
Sigma Assesses Fit Before Recommending a BI Platform
A credible BI implementation should begin with the organization’s requirements rather than a predetermined platform recommendation.
Sigma approaches analytics engagements by assessing the existing data environment, reporting requirements, governance needs, and organizational readiness before determining the appropriate technology path. Depending on the situation, that may mean preparing the data foundation first, integrating an existing analytics environment, or moving directly into BI implementation.
That readiness-first approach is reflected in Sigma’s analytics work across different technology environments.
For a Snowflake-native lending intelligence platform built with Streamlit, Sigma established the data foundation and access model alongside self-service analytics. Governance controls, including row-level security and dynamic data masking, were incorporated into the environment so broader analytics access could be introduced without treating governance as an afterthought.
The relevance of these engagements is not that one BI platform is universally better than another. It is that the technology decision followed the organization’s data, governance, reporting, and business requirements.
That distinction matters when evaluating a Tableau business intelligence solution as well. The objective should not be to justify Tableau because it was selected at the beginning of the process. The objective should be to determine whether Tableau is appropriate for the environment the organization actually has.
From Tableau Implementation to Business Value
Once Tableau is established as the right fit, execution becomes the next consideration. The value comes from translating business reporting requirements into dashboards and analytics that decision-makers can actually use—not simply reproducing existing reports in a new tool.
Sigma brings experience across data integration, dashboard development, analytics design, and enterprise reporting, with attention to how Tableau fits into the broader technology environment. That includes connecting the required data sources, structuring reporting around meaningful business metrics, and designing experiences that support how different teams consume and act on information.
The result is a Tableau environment designed around business use rather than dashboard volume—with the flexibility to evolve as reporting priorities, data sources, and analytical requirements change.
Building Tableau dashboards but struggling to turn reporting requirements into usable business intelligence?
Conclusion
A Tableau business intelligence solution can be a strong fit when an organization has sufficiently mature data, appropriate analytical ownership, and reporting requirements that justify advanced visualization and interactive analysis. But those conditions should be established before the platform becomes the center of the investment decision.
Organizations still dealing with fragmented data, unclear reporting ownership, limited analytical capacity, or relatively simple reporting requirements may need to address those conditions first. In some cases, that means improving the data foundation. In others, it means establishing an analytics operating model or choosing a simpler BI approach.
The important decision is therefore not simply whether Tableau is a capable platform. It is whether the organization is positioned to turn that capability into sustained business value.
Sigma takes that readiness-first approach to BI and analytics engagements, assessing the existing environment and business requirements before recommending the appropriate technology path.
Is your BI investment being driven by business readiness or by platform preference?
Frequently Asked Questions
How do I know if my organization’s data is ready for a Tableau business intelligence solution?
Data readiness generally means information is centralized in a warehouse or a small number of clean, consistent source systems rather than scattered across disconnected spreadsheets. If building even a basic report currently requires manually reconciling several files, addressing that centralization gap first will produce more value than a visualization platform layered on top of it.
Do we need a dedicated analyst on staff before adopting Tableau?
Not necessarily on staff, but someone, internal or through a partner, needs to be comfortable with SQL and Tableau’s calculated field logic to use its deeper capability. Without that skill available, teams typically end up using only the basic drag-and-drop features, which limits the return on the platform investment.
What happens if we buy Tableau before our organization is actually ready?
The license typically becomes a sunk cost renewed out of momentum rather than active use, while day-to-day reporting continues running through the spreadsheets the platform was meant to replace. Addressing data maturity and team readiness gaps before purchasing avoids paying for capability the organization cannot yet use effectively.
Is Tableau overkill for a business with simple reporting needs?
It can be. An organization reviewing a small, fixed set of standard metrics on a regular cadence may find a lighter, more tightly integrated reporting tool serves the need without Tableau’s learning curve or full licensing cost. Tableau’s strength shows up most clearly with genuine visualization complexity or multi-source data blending.
How is deciding whether Tableau fits different from comparing Tableau to Power BI?
The fit decision asks whether your data maturity and team are ready for a dedicated visualization platform at all, before any specific vendor enters the conversation. Comparing Tableau to Power BI assumes that readiness already exists and evaluates two platforms against each other on cost, connectors, and learning curve instead.